Spring hotel pricing and bookings: are you ahead of last year?
Discover which data to review and analyze your future performance in 5 steps before spring and summer.
At this time of year, once the Christmas and New Year period is behind you, many hoteliers begin planning for the spring and summer season. The most common question is: are future bookings performing better or worse than last year?
February is the ideal time to find out. By now, you should already have enough forward bookings to make meaningful evaluations, but you are still early enough to intervene if something is not adding up.
The real issue is the method you use. The most common mistake is simply comparing this year’s bookings to last year’s numbers.
If you do not also consider booking pace, lead time, ADR performance, and the impact of cancellations, this comparison can be misleading and, in some cases, counterproductive.
That is why in this article you will find a 5-step check-up you can use today to understand whether your spring and summer strategy is working or whether adjustments are needed.
Check #1: Booking pace
Booking pace refers to the speed at which you are selling rooms. It answers a simple question: are you selling faster or slower than last year?
This is critical information because a slower-than-normal booking pace is often the first sign that something is not working as it should. It may depend on:
- Rates that are not aligned with current demand
- Insufficient visibility across sales channels
- A strategy that reacts too slowly to market changes
The most common mistake is waiting until closer to the stay date to “see how it goes.” When the delay becomes obvious, it is often too late to recover lost revenue.
Practical example: how to analyze booking pace for your hotel
Imagine you want to evaluate booking pace for the month of March. To determine whether your pace is healthy, you should analyze:
On-the-books nights (OTB)
Compare how many nights you have already sold today for March, meaning confirmed future bookings, with how many nights had been sold by the same date last year.
Pickup variation
Look at how many new nights are being booked each week for March. This is your pickup, meaning the increase or decrease in bookings over a specific period. Then verify whether your sales rhythm is aligned with, faster than, or slower than the same period last year.
How to interpret the data
By combining on-the-books and pickup data, you may find yourself facing different scenarios:
- OTB in line or higher, but pickup slowing down: you are selling well, but demand may be starting to saturate.
- Lower OTB, but accelerating pickup: demand has not disappeared; it is simply booking closer to arrival.
- Higher OTB and faster pickup: you are building bookings earlier than last year.
- Lower OTB and weak pickup: this may signal misaligned pricing or insufficient visibility.
Check #2: Occupancy and ADR
After understanding how fast you are selling, the next step is evaluating the quality of your sales. This analysis answers the question: “Am I selling well compared to last year?”
This check helps you decide whether you can continue monitoring the situation or whether immediate action is necessary before the impact becomes harder to reverse.
Practical example: how to analyze occupancy and ADR
Let’s continue with our March example and imagine you want to verify whether next month’s performance is aligned with historical results. To do so, analyze the following elements:
On-the-books occupancy (OTB)
Compare the occupancy already confirmed today for March, meaning future confirmed bookings, with the occupancy you had on the same date last year.
Future ADR vs. last year’s final ADR
Look at the average daily rate you are currently achieving for March and compare it with the final ADR recorded last year for the same month.
ADR pickup (increasing or decreasing)
Analyze whether the new bookings coming in are pushing your March ADR up or down.
How to interpret the data
By combining occupancy and ADR, you may face several possible scenarios:
- OTB equal or higher, but future ADR declining: you are filling rooms, but losing revenue that may not be recoverable.
- Lower OTB, but future ADR in line or higher: you are selling fewer rooms, but at better quality. Continue monitoring.
- Higher OTB and higher future ADR: positive signal. Healthy demand and a more effective pricing strategy than last year.
- Lower OTB and lower future ADR: possible sign of weaker demand or incorrectly positioned pricing.
If you want to complete your analysis by understanding how competitors are performing, you can read our article on how to monitor competitor occupancy.
Check #3: Booking window
After analyzing sales pace and revenue quality, the next step is understanding when bookings are coming in. This check clarifies an important point: is demand truly weaker, or is it simply shifting closer to arrival?
The booking window indicates how far in advance guests book relative to their stay date. A shortening booking window can make your data look worse than expected, when in reality guest behavior has simply changed.
Practical example: how to analyze the booking window
Let’s return to the March example. To evaluate the booking window, review the following:
Average booking lead time
Check how many days in advance bookings for March are currently being made and compare this with the same period last year.
Distribution of bookings over time
Assess whether bookings for March are concentrating closer to arrival or entering more evenly over time.
Historical comparison
Analyze whether, at the same point last year, most March bookings had already been made, or whether demand historically tends to materialize closer to arrival.
How to interpret the data
When you combine these elements with the analyses from the previous steps, different scenarios may emerge:
- Shorter booking window, but accelerating pickup: demand has not decreased. It is simply shifting closer to arrival.
- Shorter booking window and weak pickup: guests are booking closer to arrival compared to historical patterns, but booking volume does not recover even as the stay date approaches. This may signal a real slowdown in demand.
- Booking window in line with historical trends, but lower OTB bookings: guests are booking with the same lead time, but you have fewer confirmed bookings compared to the same date last year. This may indicate weaker demand or reduced competitiveness.
- Longer booking window than usual: guests are booking earlier than normal. This may be the result of early booking campaigns or special offers.
Check #4: Cancellations
Monitoring cancellations is equally important. It helps you understand how reliable the bookings you are accumulating really are, before it is too late to react.
Practical example: how to analyze cancellations
To evaluate demand stability for March, analyze the following data:
Canceled nights vs. last year
Compare how many nights are being canceled today for March with the same period last year.
Booking-to-cancellation ratio
Look at how many nights are being booked and how many are being canceled during the same timeframe. A seemingly positive pickup may conceal a much weaker net result if cancellations are increasing at the same pace as new bookings.
Weeks with high bookings and high cancellations
Identify weeks where many bookings are coming in but cancellations are also rising. This often signals uncertain or unstable demand.
If you detect a high volume of cancellations in February, it may be due to:
- Overly aggressive pricing
- Stronger competitive pressure
- Volatile or unstable demand
Check #5: Events
February is also the right time to verify whether your calendar already includes relevant events that may influence demand in the coming months.
This does not only refer to major international events, but also trade fairs, sporting events, concerts, or local happenings that can generate sudden spikes in demand.
The most common mistake is opening your calendar with standard pricing and realizing an event is taking place only when occupancy begins to rise, at which point part of the revenue potential has already been lost.
At this stage of the year, you should ask yourself:
- Do I have upcoming dates with potentially above-average demand?
- Do my current prices already reflect this opportunity, or am I leaving little room for growth?
Discover events that can increase your prices. Free tool.
How to run all checks from one screen with Smartpricing
Manually tracking all the checks discussed so far requires time and well-organized data: booking history, cancellations, future occupancy, ADR, and year-over-year comparisons. In practice, this means opening multiple reports, cross-checking spreadsheets, and manually reconstructing information that is often not immediately accessible.
With Smartpricing, you can run all these checks from a single screen: the Pickup Report.
To start your analysis, simply access the “Pickup Report” section and set the following parameters:
- Pickup period
This refers to the time frame during which you want to analyze bookings and cancellations. By selecting “Year to date,” you will analyze all bookings and cancellations recorded from January 1 of this year through today. - Stay period
This is the period you want to evaluate, for example March 1, 2026 to March 31, 2026. Alternatively, you can select “Current year” to view all months at once. - Data granularity
This allows you to choose whether to display data on a daily, weekly, or monthly basis. When analyzing multiple months, the monthly view provides a clearer overview.
With these settings in place, the report will immediately display the data for your selected pickup period: number of booked nights, number of canceled nights, revenue, and ADR.
Let’s now apply the checks discussed in this article.
How to analyze booking pace and cancellations with Smartpricing
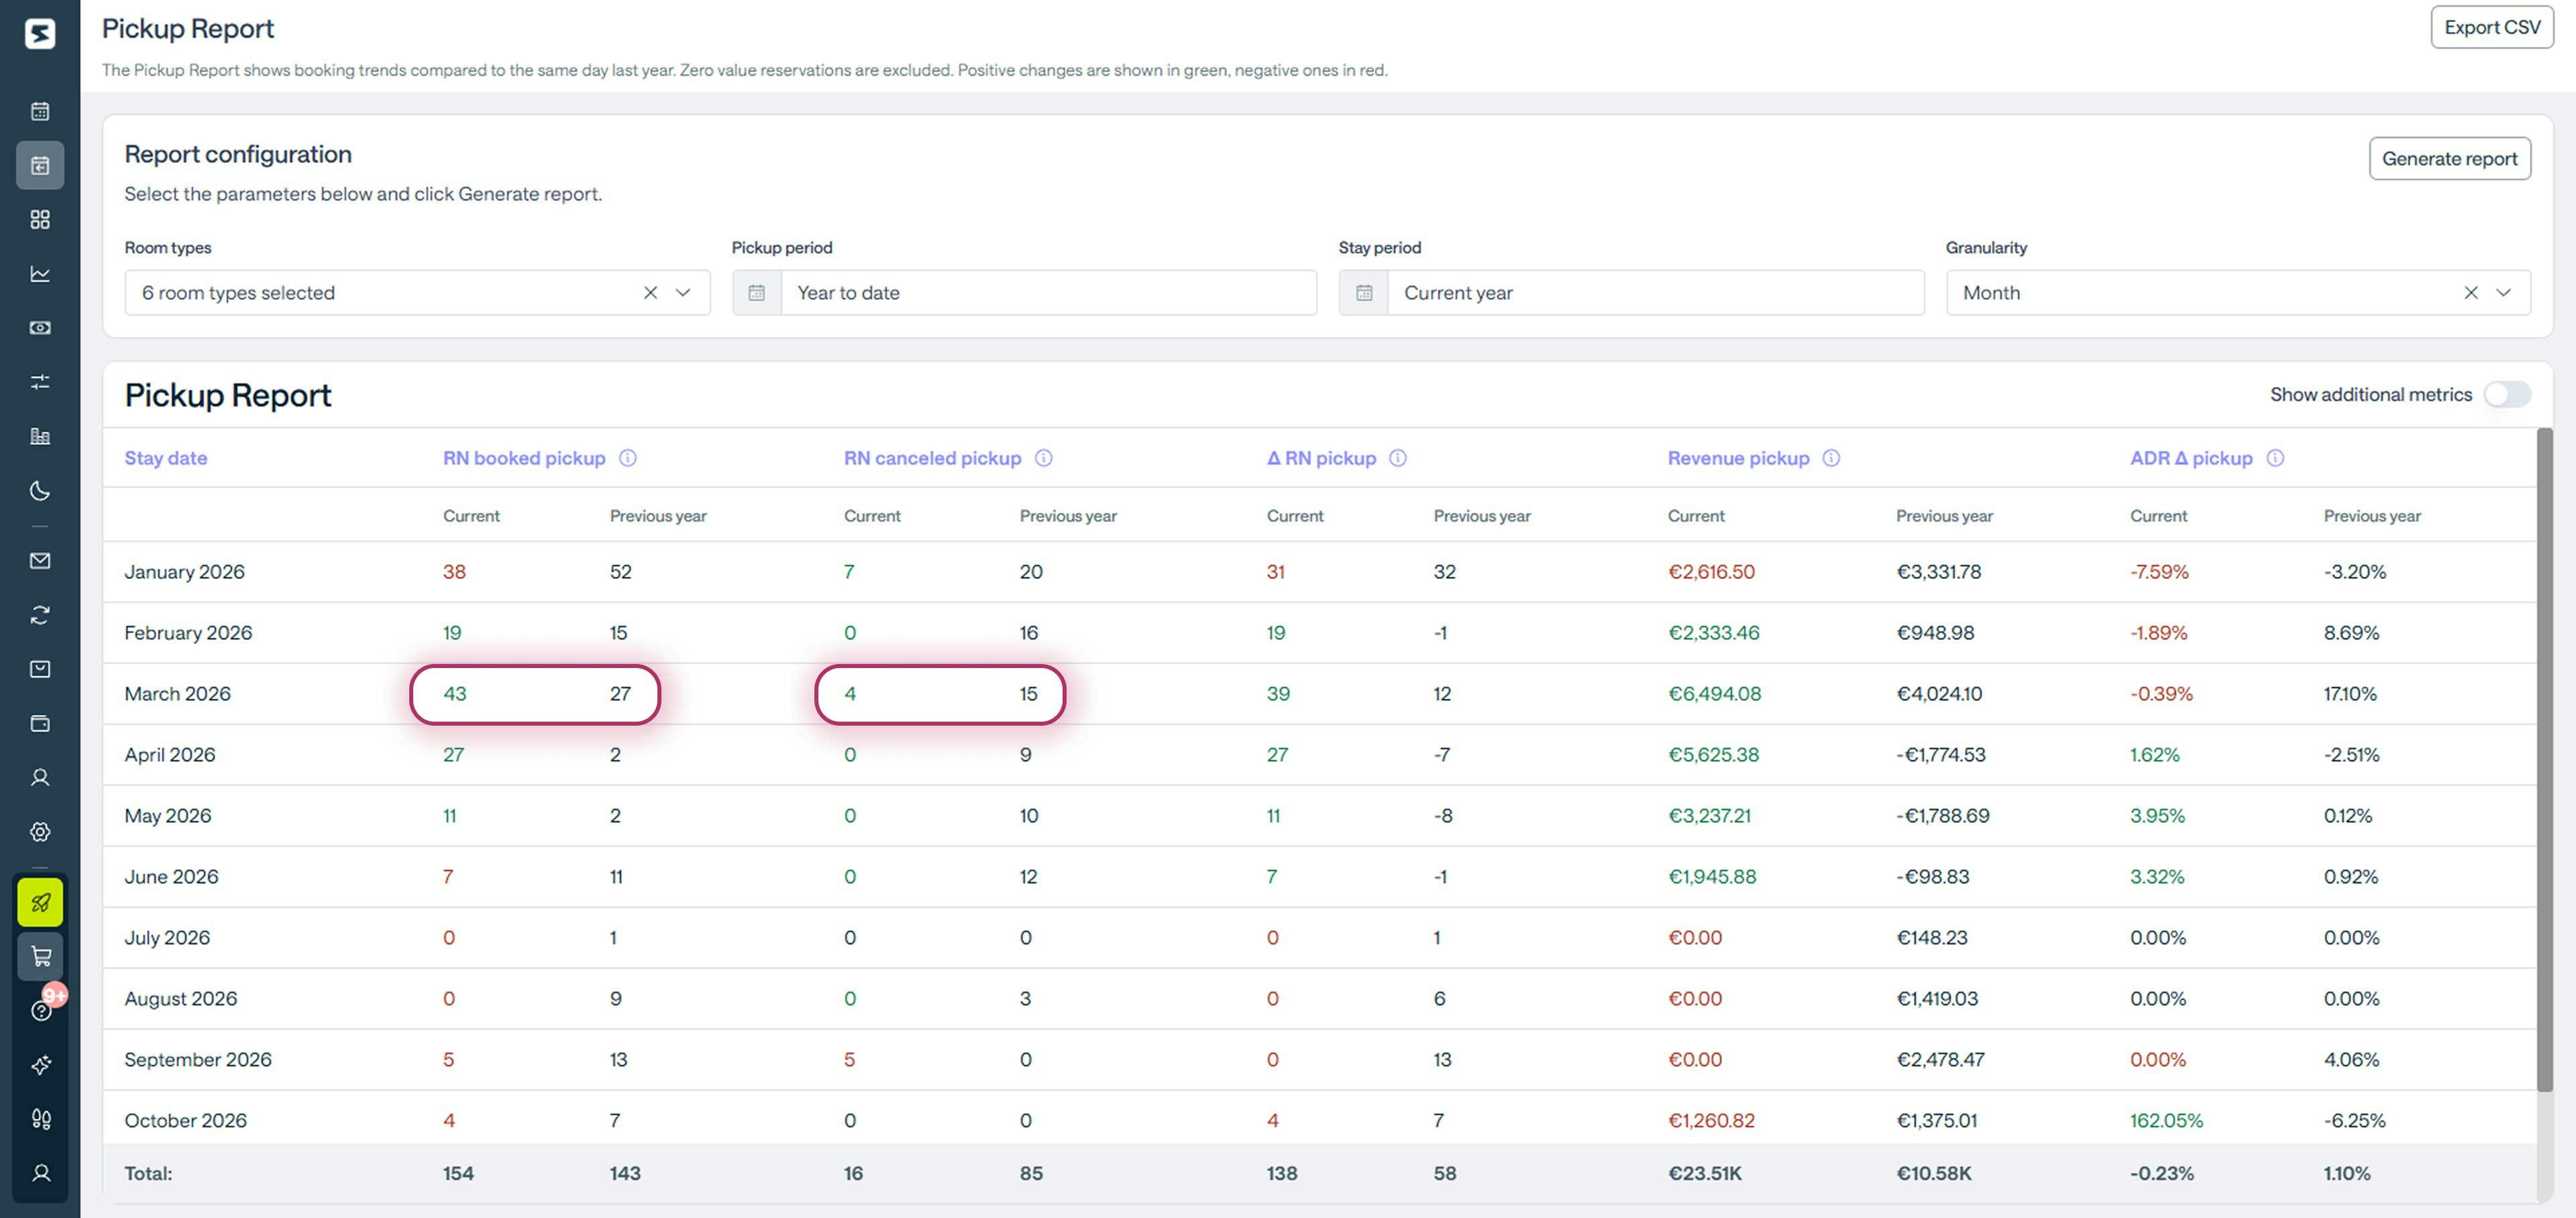
Looking at the row for March 2026, we can see that from January until today, 43 room nights have already been booked, compared to 27 during the same period in 2025. At the same time, cancellations are significantly lower, with 4 room nights compared to 15 last year.
In just a few seconds, you can clearly see that your booking pace is faster than your historical trend.
How to analyze occupancy and ADR with Smartpricing
To view occupancy and ADR data, simply click on “Show additional metrics” in the top right corner.
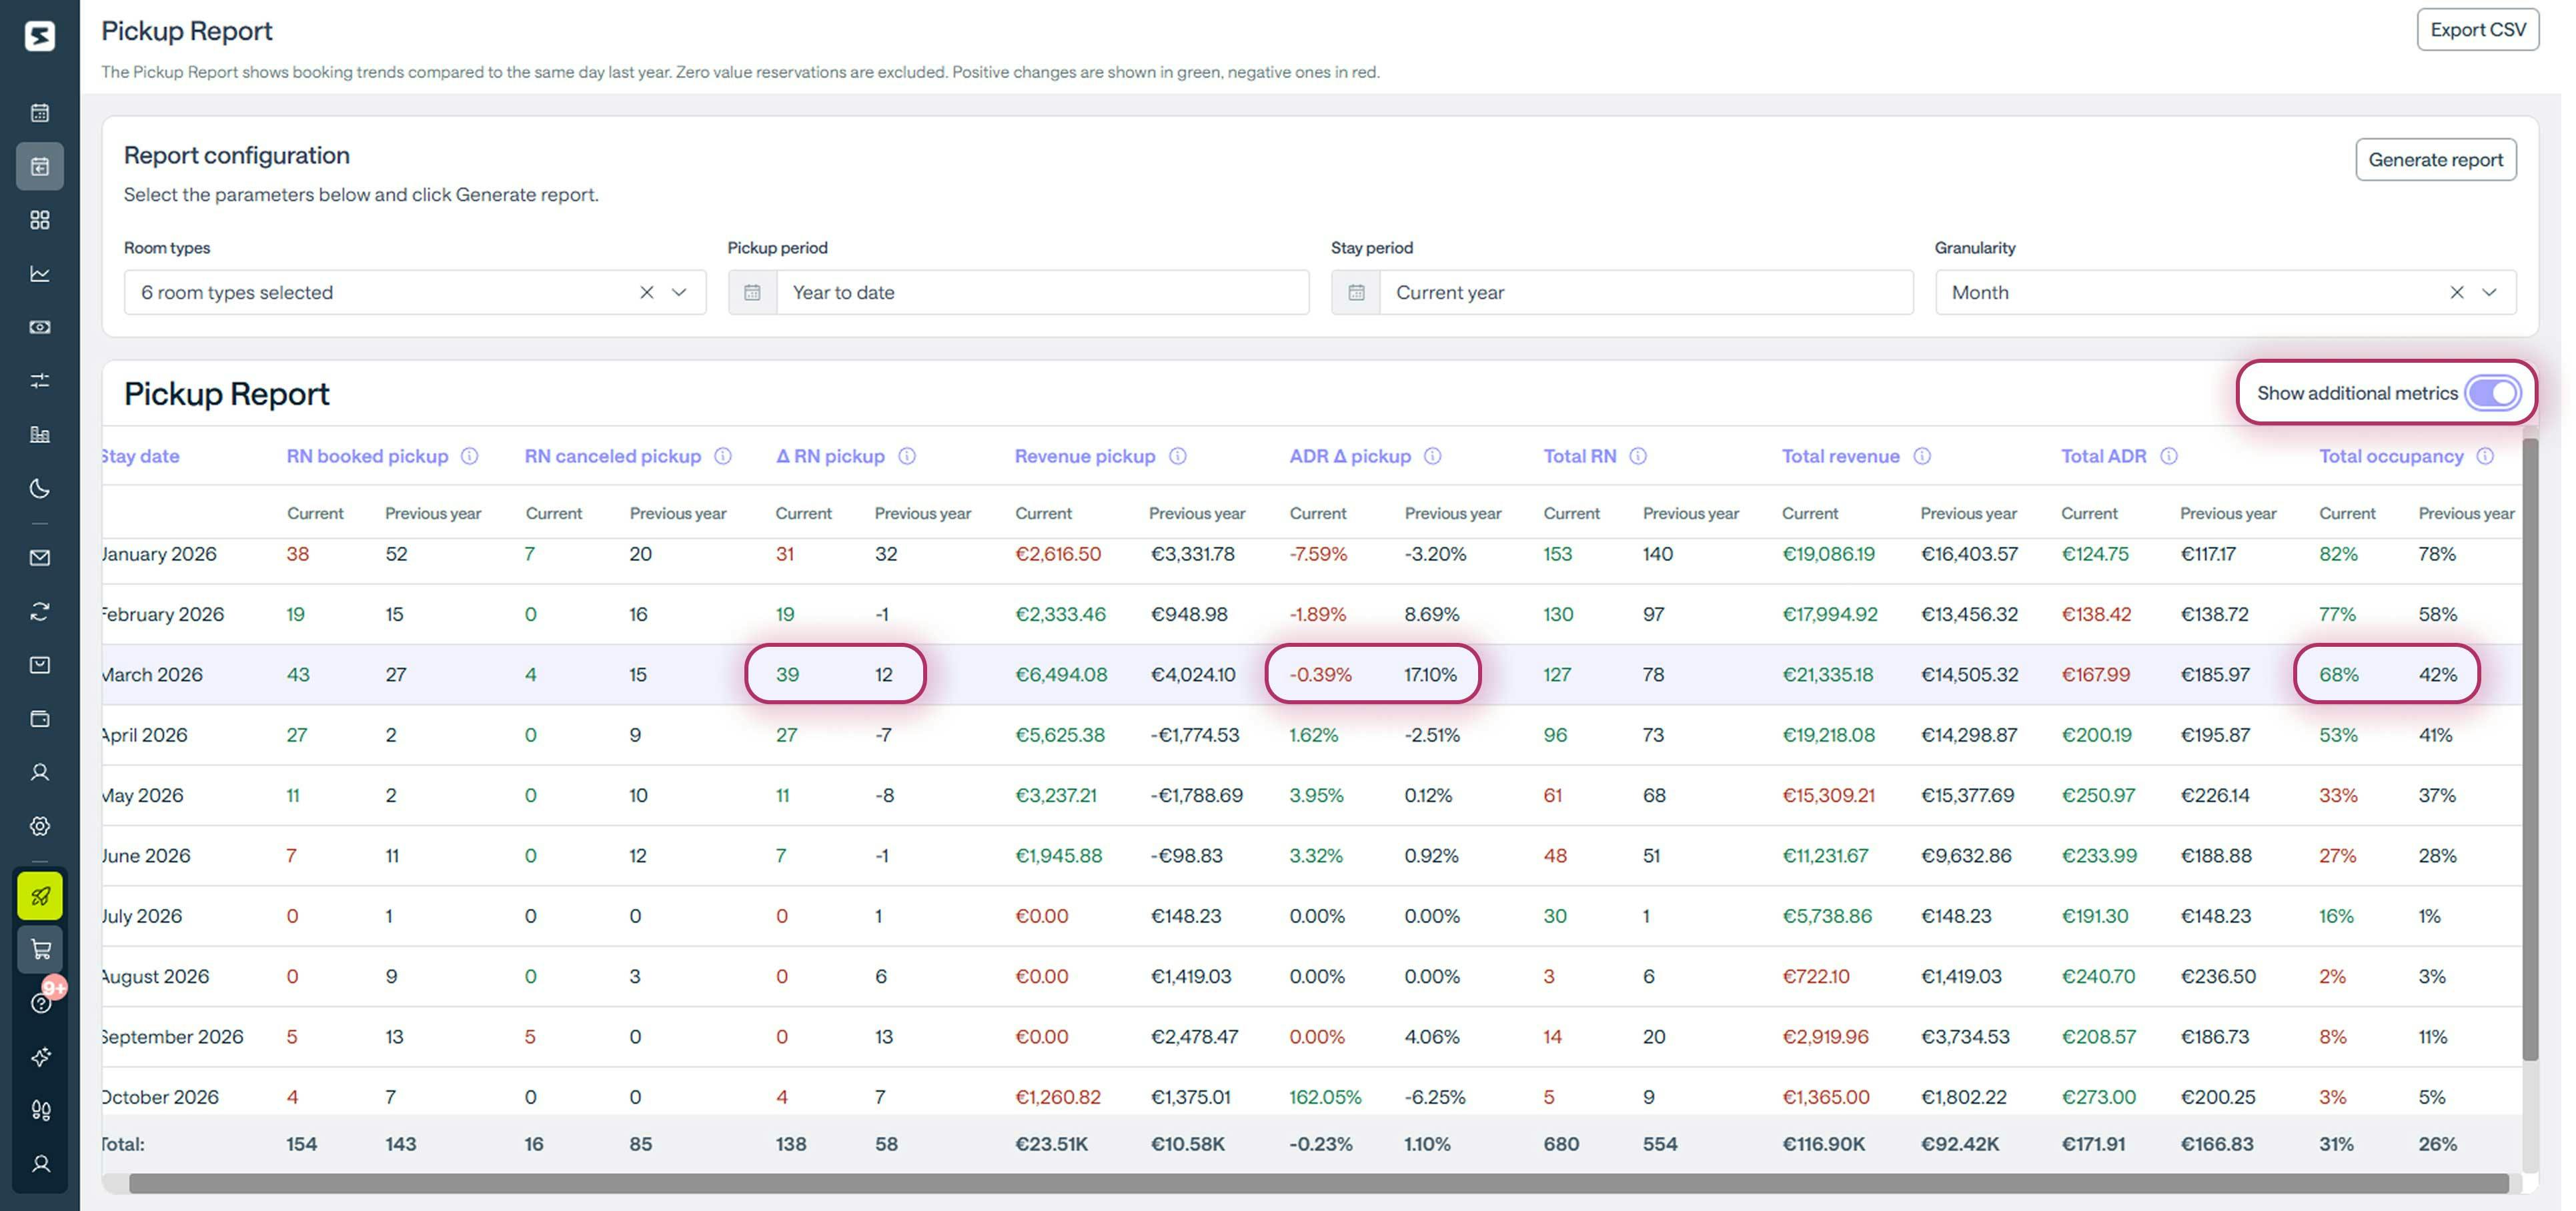
Looking again at the March row highlighted in the screenshot, we can immediately see that:
- On-the-books occupancy is higher at 68 percent compared to 42 percent last year.
- ADR has decreased by 0.39 percent during the selected pickup period.
Within one minute, and without running any calculations, you gain a second important insight: demand for March is stronger than last year, but bookings are coming in at a more cautious average rate.
So what should you do?
Considering that last year’s rate increase of 17.10 percent slowed bookings and occupancy, the most sensible approach is not to repeat that strategy. Instead, adjust rates gradually and monitor how demand reacts before pushing prices further.
How to analyze the booking window with Smartpricing
To evaluate the booking window, look at the “Total occupancy” and “∆ Pickup nights” columns for March 2026.
Last year, occupancy stood at 42 percent, while pickup from the beginning of the year until today generated a net balance of +12 nights.
This year, occupancy is at 68 percent, with a net pickup of +39 nights. Clearly, the slightly lower ADR has also helped bring bookings forward compared to historical patterns.
The final result of our check-up shows that the pricing strategy applied for March is proving effective, and projected revenue confirms this trend, with an increase of 47 percent.
As we have seen, with Smartpricing you can run a complete performance check-up in just a few minutes, whenever you need it, and quickly understand whether and where adjustments are required.
At the same time, Smartpricing’s algorithm already takes booking pace, occupancy, ADR, booking window, and events into account, using this data to continuously and automatically optimize your rates.
Would you like to see how it works?
Request a personalized demo
Talk to a Smartness expert and discover how to automate your pricing strategy and increase your property’s revenue by an average of 30 percent. Free, no obligation.
March 2026: what’s happening to hotel bookings right now and what to do
March 2026: what’s happening to hotel bookings right now and what to do.
How events affect hotel rates: what Radiohead and the Winter Olympics can teach you
Learn how to properly estimate event impact and sell your rooms at the most profitable rate.